Use Case: Self Service GIS - A Vision
Voor de Nederlandse versie, klik hier.
Introduction
Kadaster’s multi-year strategy plan seeks to provide “geo-information for everyone” to support the answering of the most pertinent societal questions. While we are able to offer much of the data we currently have in a technical format which suits developers well, making data available in order formats and through other means will allow a wider range of users to access and interact with Kadaster’s data.
Our long term strategy is to be able to provide citizens with the ability to make use of both Kadaster’s data as well as data from other (open) sources in order to allow for users to easily explore Kadaster’s data, combine these with their own data and for spatial analyses of some level to be easily performed online. This brings the data closer to the user, allowing customers to gather answers to their questions themselves.
One solution to this, and one that is most applicable to Kadaster’s strategy, is the use of web technologies to bring this “self-service” tool to Kadaster’s end users in the form of an interactive web mapping interface or web GIS. The following page will provide some insight inot how “self-service GIS” can be achieved within Kadaster.
Target Audience
The purpose of developing this self-service tooling is to provide the engaged user and active citizen with the means to perform spatial analysis as they seek to answer a spatially driven question. This user group could include a data or investigative journalist looking for a pattern of behaviour, a potential new homecomer looking for environmental information about their new home or a member of a housing association looking to investigate crime rates in their neighbourhood.
This user group is typically not well versed in the technical intricacies of spatial analysis of the capabilities of GIS but is simply interested in making use of a combination of Kadaster-provided data with data from other providers or their own data to answer a particular spatial question which requires spatial analysis functionality.
What are the features of Self-Service GIS?
Self-Service GIS Defined
Esri, the leading commercial provider of geospatial software and cloud services for geoinformation, defines self-service GIS as an extension to the typical functionality found within a web GIS. Generally, a self-service GIS is an application which allows for easier user interaction and simple analysis of geospatial data through web-based geographical applications.
In providing for the user group above, the question of what the features of self-service GIS are is posed. These features can include both the functionality that should be available to the user in the application from a user interface perspective but also includes what data or which features of this data should be available to the user in the web application. To identify what the features of self-service GIS are for Kadaster’s purpose and target audience, we look to our customers to see what features may be useful.
An analysis of what spatial questions are being asked by Kadaster’s customers is performed as part of an internal user needs analysis. What questions are asked will highlight what functionality may be useful for users in a self-service GIS application. It also provides insight into how users are looking to make use of Kadaster’s data and what data Kadaster’s data is usually combined with in answering spatial questions.
The features included in Kadaster’s vision for self-service GIS is also dependent on the technological capabilities and future vision for Kadaster as a whole.
Technological Approach
In order to design the technological approach to this use case, we first need to investigate what self-service tooling and experiences are currently available as a way of garnering inspiration for a Kadaster-specific self-service GIS. Our investigation take us beyond GIS specific tooling and also looks at other examples of data exploration and browsing tooling options that do not have geovisualisation capabilities but do have interesting features which could be integrated into a self-service GIS.
The tooling examples are divided into three categories as below. Where possible, demonstrators for each category have been included to showcase the functionalities of interest in our investigation.
Analytics Dashboards
The following are examples of more advanced tooling examples or dashboards which offer the user some level of analytical functionality.
Voyager
The first example is a short usage session of a data from this case loaded into a Business Intelligence tool. The importance of this demonstration for self-service GIS is the features that this tool offers the user for data interaction. These include graph visualisation, temporal fields and filtering.
Gruff
The second example demonstrators the browsing and querying of BAG data within Gruff, a tool which supports knowledge graph browsing and the analysis of enterprise data. The interesting feature for the purpose of self-service GIS is the graphical query editor.
Querying Interfaces
There are a range of SPARQL clients available to the end user for the purpose of querying Linked Data. We best showcase the use of these clients in our data stories. Please look at some of the examples below.


Achieving Self-Service GIS
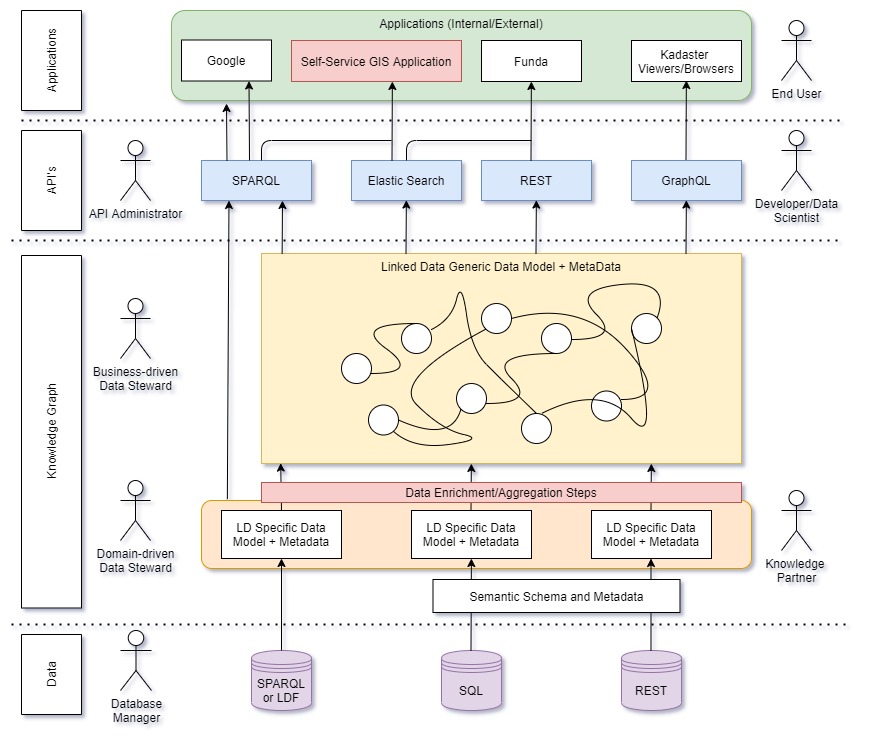
At Kadaster, we are working on the development of our Knowledge Graph by integrating the data we maintain into one source. With this at the centre, our self-service GIS would be able to provide our users with easier access to all our datasets simultaneously and in real-time; improving accessibility to and engagement with geospatial and non-spatial data for our users.

